:
:
Recall the saved volume setting file and, if you are using an amplifier, turn its volume to get the desired voltage (between 0.2-0.7 Vrms AC) using SW sinewave generator. Then open Speaker Workshop and go to: OPTION/ PREFERENCE/ MEASUREMENT and check that the Sample rate is the chosen one and let the Sample Size to its maximum (256k in my example); increase the Repeat Count to 10 or more: in this way the results are more reliable even if the measurement time is longer. Choosing the right sample rate is very important: using 48k Hz SR and 131k of resolution will give a response from 0.37 to 24k Hz ± 0.37 Hz, more than sufficient in most cases; in some cases where a better precision is needed (for example when measuring a driver with low Fs and high Qms value), you can use 256k SS and even lower the SR but remember to increase the Repeat Count since SW is very sensitive to noise.
Click on
:
|
|
Crete a folder with the driver name: RESOURCE/ NEW/ FOLDER that I named “FOCAL A”; now create a driver: RESOURCE/ NEW/ DRIVER and name it "FOCAL A"; drag and drop the new icon into the "FOCAL A" folder:
|
|
Double click on
![]() , then MEASURE/ IMPEDANCE IN FREE AIR or just click on
, then MEASURE/ IMPEDANCE IN FREE AIR or just click on
![]() and you will hear a whisper coming out from the driver. In the tree
menu there will be a new file that is the free air impedance of the
Focal A:
and you will hear a whisper coming out from the driver. In the tree
menu there will be a new file that is the free air impedance of the
Focal A:
|
|
Double click on
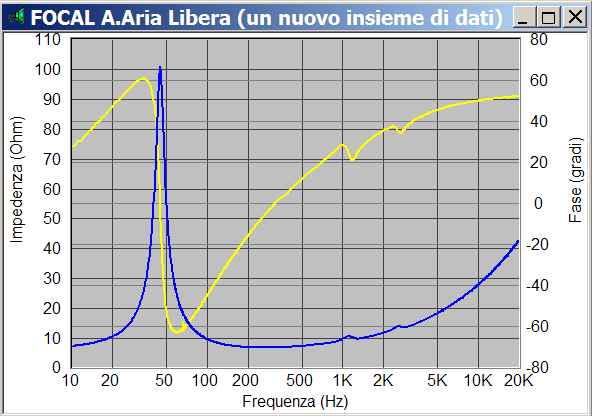
 and its chart will appear (in my chart the blue line is the impedance
while the yellow is the phase):
and its chart will appear (in my chart the blue line is the impedance
while the yellow is the phase):
|
|
|
Free air impedance measured with Speaker Workshop |
|
Impedance as given by Focal |
Probably the chart doesn't appear good, so double click in it and make the changes as follows:
|
|
|
|
I used a very high value in
the Y Axe (110) because the Focal woofer has a 101 Ω
max impedance, while usually this value is in the 20-50 Ω range,
so adjust it according to your driver maximum impedance. Remember to
click on the Make Chart Default to save the chart properties. You can
zoom in and out the chart or just a part of it using the
![]() icons and selecting an area with the mouse.
icons and selecting an area with the mouse.
Comparing the two charts, the one we measured and the one published by Focal, we can see how similar they are: notice the two little peaks at 1090 and 2490 Hz. Till now SW is doing a great job!
To calculate Thiele and Small
parameters, double click on
![]() and a new window open up:
and a new window open up:
|
|
Click inside of it with the right mouse button and select PROPERTIES and then DATA :
|
|
Write the drive dc resistance,
measured with the multimeter, and check the box. In the Impedance
in free air box there will appear the name of the file
created during the measurement (FOCAL A.Aria Libera). Select
the tab Parameters and in the Given area write
the parameters as given by the driver manufacturer: actually SW uses
only one of these five, the Sd, but since you have those datas, why not
putting in. The measure units, if blued, can be changed just clicking
on it. At the end click on
![]() :
:
|
|
Now let SW calculate the T/S parameters: open the menu DRIVER/ ESTIMATE PARAMETERS.. :
|
|
If the measured curve is clean, as
the one I measured, we can leave the first option; otherwise use an
appropriate frequency range, making sure you make the upper cutoff
high enough to show plenty of impedance or the estimates of the
inductances could be pretty far off (which will not affect things
much when it comes to designing a box). Click on
![]() , and after few sec a message will appear: don't worry all the
parameters will be calculated with the exception of the Vas:
, and after few sec a message will appear: don't worry all the
parameters will be calculated with the exception of the Vas:
|
|
And here is T/S driver parameters window:
|
|
Notice that a new file appear in
the folder,
![]() ,
that is just the impedance calculated on the estimated parameters.
Open it and compare it with the
,
that is just the impedance calculated on the estimated parameters.
Open it and compare it with the
![]() chart: if the two charts are similar, it means that the estimate is
right.
chart: if the two charts are similar, it means that the estimate is
right.
The next step is to compare the given parameters with the one SW generated: with this Focal there are 11 % differences in the resonance frequency, and 27 % in the Qts! Now you can see how important is to measure the driver we are going to use, cause manufacturer data often are not reliable. However keep in mind that the Fs and the Q's are signal level dependent, that is at higher levels both Fs and the Q's lower; therefore to compare 2 different measurement system, at least the same signal level has to be used. Just remember that Thiele and Small parameters are intended for small signals; for large signal check Klippel papers.
Well, looks like we are done...not completely. We have to measure the second Focal! Even if some drivers, like the Focal, are sold in selected couple, you will see there are differences too. So create a new folder and driver, Focal B, and repeat the procedure.
When finished, follow me in the Vas.